
Graph Theory, Part I
A graph is a (nonempty) set of vertices (or nodes) together with a set of edges (or arcs) each of which connects a pair of nodes. (The word graph here is kind of misleading because doesn't refer to most types of graphs you might be used to, like bar graphs or graphs of functions, but rather is just a set of dots with arcs connecting them in a network.) It's very helpful to have an image of this in mind. We often draw the nodes as dots and the edges as segments or arcs connecting the dots. Here's an example:
This simple abstract structure of nodes and arcs may serve as a model for all sorts of data of surprisingly diverse nature. Because of this, graphs are extremely useful and the algorithms involving graphs have lots of practical applications. For example, the nodes might represent people and the edges represent whether or not they have met. Or the nodes might represent cities and the edges represent that there is a direct airline flight between two cities. Or the nodes might represent towns and the edges represent roads between the towns. Or the nodes might represent states in a finite state machine, and the edges represent transitions between them. Or the vertices might represent data, and the edges represent how the data are organized.
Here's another example of a graph:
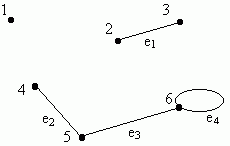
In the above example, there are 6 nodes and 4 edges. Edge e1 connects nodes 2 and 3, edge e2 connects nodes 4 and 5. Edge e3 connects nodes 5 and 6, and e4 connects node 6 to itself.1 and 6. Note that node 1 is not connected to any other node. Note that there are no edges connecting nodes 2 and 3 to any of the other nodes.
In the drawing of a graph, the arrangement of the vertices and the placement and shape of the edges is not important - all that matters is the vertices themselves and which vertices each edge connects. To illustrate this, the image below is a drawing of the same graph as the above image.
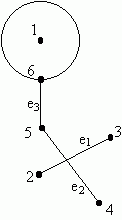
It's often useful to describe a graph without having to draw a picture of it. As an example, let's define the above graph. Remembering that a graph is just a list of vertices and a list of edges, we can define the vertices by listing them by name or number, and then we can define each edge as a pair of vertices.
    G = (V, E)               (The graph G is given by the set of vertices V
                              together with the set of edges E)
    V = {1, 2, 3, 4, 5, 6}   (The vertices are called 1, 2, 3, 4, 5, and 6)
    E = {(2, 3), (4, 5), (5, 6), (6, 6)}
                             (There are 4 edges, the first connecting vertices 2 and 3,
                              the second connecting vertex 4 and 5, etc.)
Directed graphs
In a graph, an edge connects two vertices, and this connection goes in both directions. Imagine that edges are streets that you can travel either way on. An edge between nodes 2 and 3 allows you to travel from node 2 to node 3 and also from node 3 to node 2. There is no difference between the edge (2, 3) and the edge (3, 2). Sometimes, however, we want a model that allows one-way streets. This is the purpose of directed graphs. In a directed graph, the edges go from one node to another, and can be represented by segments with arrows pointing from one vertex to another. If the vertices represent people and the edges represent whether one person knows the name of another, then a directed graph is more appropriate than a graph, because, for example, I know Brad Pitt's name, but he does not know mine. If the vertices represent locations on a map and the edges represent roads, then a directed graph is more appropriate than a graph, because some roads are one-way. The world-wide-web is an example of a directed graph, where the vertices are web pages, and a link from one page to another is an edge. Here's a drawing of a directed graph:
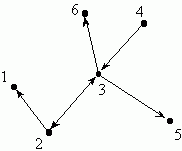
The above directed graph can be represented as follows:
    G = (V, E)               (The directed graph G is given by the set
                              of vertices V together with the set of edges E)
    V = {1, 2, 3, 4, 5, 6}   (The vertices are called 1, 2, 3, 4, 5, and 6)
    E = {(2, 1), (2, 3), (3, 2), (3, 5), (4, 3), (3, 6)}
                             (Here, the edge (2, 1) goes from vertex 2 to vertex
                              1.  The two edges (2, 3) and (3, 2) show that the
                              vertices 2 and 3 are connected in both directions.)
Actually, every graph can be described as a directed graph as well: for
each edge (a, b) in the graph, just describe it with the two directed edges
(a, b) and (b, a). On the other hand, not every directed graph can be
described as a graph.
Weighted graphs
Sometimes we need a way to show a difference in weight for each of the edges. This difference in weight might represent many different things, depending on the application. For example, if the vertices of a graph represent people and the edges represent whether or not they know each other, then the weight might represent how long they have know each other. If the nodes represent cities and the edges represent roads between them, then the weight might represent the number of cars per hour that can be carried by these roads. If the nodes represent locations, then the weights might represent distances between those locations. Like graphs, directed graphs have very many applications. While every graph exists as an abstract structure, we're often interested in applying it to something real. So when someone presents you with a graph, it's useful to ask them what they are imagining it represents.
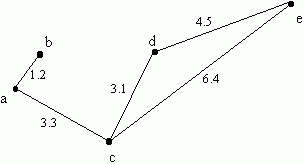
The above weighted graph can be represented as follows:
    G = (V, E)               (The weighted graph G is given by the set
                              of vertices V together with the set of edges E)
    V = {a, b, c, d, e}      (The vertices are called a, b, c, d, and e)
    E = {(a, b, 1.2), (a, c, 3.3), (c, e, 6.4), (c, d, 3.1), (d, e, 4.5)}
                             (Here, each edge lists the two vertices it connects
                             along with the weight of the edge.  For example,
                             edge (a, b, 1.2) connects vertex a and b, and has
                             weight 1.2)
Representing graphs, weighted graphs, and directed graphs with adjacency matrices
Besides specifying the vertices and the edges in a list, there's another succinct way of describing a graph using a matrix. First, assume that the vertices are numbered from 1 to n. The edges are defined by the elements in an n×n matrix. The number in row i column j tells you about the edge between vertex i and vertex j. For a graph, put a 0 if there is no edge between vertex i and vertex j and a 1 if there is. Notice that the matrix must be symmetric. In other words, the number in row i column j is the same as the number in row j column i. For a directed graph, put a 0 in row i column j if there is no edge from vertex i to vertex j, and put a 1 in row i column j if there is an edge from vertex i to vertex j. For a directed graph, the matrix need not be symmetric. For a weighted graph, again put a 0 in row i column j if there is no edge between vertex i and vertex j, and if there is, then put the weight of that edge in the matrix. Here are some of the previous examples, along with the adjacency matrices that describe them:
|
    _             _
    | 0 0 0 0 0 0 |
    | 0 0 1 0 0 0 |
    | 0 1 0 0 0 0 |
    | 0 0 0 0 1 0 |
    | 0 0 0 1 0 1 |
    | 0 0 0 0 1 1 |
    -             -
|
|
    _           _
    | 0 0 0 0 0 |
    | 1 0 1 0 0 |
    | 0 1 0 1 1 |
    | 0 0 1 0 0 |
    | 0 0 0 0 0 |
    | 0 0 0 0 0 |
    -           -
|
|
    _                         _
    | 0    1.2  3.3  0    0   |
    | 1.2  0    0    0    0   |
    | 3.3  0    0    3.1  6.4 |
    | 0    0    3.1  0    4.5 |
    | 0    0    6.4  4.5    0 |
    -                         -
|
For this example, assume the vertices are numbered a=1, b=2, c=3, d=4, e=5 |