Introduction to dudraw
What can you do with dudraw?
The python package dudraw is a minimal graphics library developed for teaching a beginning python programming class. Its starting point was stddraw, developed at Princeton University (see Elements of Programming in Python). At the University of Denver we modified and enhanced that package to produce dudraw.
The dudraw package has graphics primitives for drawing points, lines, circles and ellipses, squares and rectangles, triangles, quadrilaterals, polygons, circular and elliptical sectors, annuli and text. You can set the color you want the objects to be, and the width of points, lines and outlines.
You can find out about key-clicks and mouse presses from the user, and respond to them within your program. You can clear the background or use an image from a file as your background. You can save the image you produce to a file.
The dudraw package is a paint-style graphics package. In other words, you draw graphical objects, but they cannot be moved or deleted after being drawn.
How do I get access to dudraw?
First make sure that you have followed all the installation steps on the Python, VSCode, and dudraw Installation page. If you've successfully completed these steps then start your python program with the line
import dudraw
and you will be able to call any of the functions in dudraw.
If you were unable to install dudraw with the normal installation instructions, please reach out to a teacher or TA for help and they will have you attempt to install dudraw using the command line for your operating system and issuing a command like:
pip install dudraw
Again, please ask for help if you're having trouble installing dudraw.
How do I use dudraw?
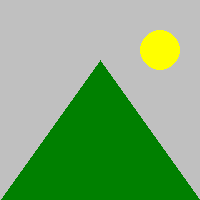
Begin by creating a canvas of a specified size (in pixels), then issue graphics commands. When you are done, call the show()function and a window will appear with the image you have created. The parameter to the show() function is the number of milliseconds to display the image. Unless you set the scale, the default scale is from 0 to 1 on the x-axis and 0 to 1 on the y-axis. Here's a simple program, and the image it produces.
import dudraw

# open a square window, parameters are width and height, in pixels
dudraw.set_canvas_size(200,200)

# fill the canvas with the given color
dudraw.clear(dudraw.LIGHT_GRAY)

# once the pen color is set, that is the color used until it is changed again
dudraw.set_pen_color(dudraw.DARK_GREEN)

# draw a triangle with vertices (0, 0), (1, 0) and (0.5, 0.7)
dudraw.filled_triangle(0, 0, 1, 0, 0.5, 0.7)
dudraw.set_pen_color(dudraw.YELLOW)

# Draw a circle with center at (0.8, 0.75), with a radius of 0.1
dudraw.filled_circle(0.8, 0.75, 0.1)

# Display the canvas
dudraw.show(10000) # display the result for 10 seconds
How do I get more colors?
This is a list of the colors pre-defined in dudraw:
dudraw.WHITE
dudraw.BLACK
dudraw.RED
dudraw.GREEN
dudraw.BLUE
dudraw.CYAN
dudraw.MAGENTA
dudraw.YELLOW
dudraw.DARK_RED
dudraw.DARK_GREEN
dudraw.DARK_BLUE
dudraw.GRAY
dudraw.LIGHT_GRAY
dudraw.ORANGE
dudraw.VIOLET
dudraw.PINK
dudraw.BOOK_BLUE
dudraw.BOOK_LIGHT_BLUE
dudraw.BOOK_RED
To create colors of your own, first note that a color on a computer monitor can be defined by an intensity for red light, green light and blue light, each of which is an integer value from 0 to 255. Colors on a compter monitor are additive like light, rather than subtractive like paint. For example, to create yellow light, you add together green light and red light. So the brightest yellow is defined by red = 255, green = 255, blue = 0. You can use many different programs to experiment with choosing colors. On many browsers, if you do an internet search on "color picker" one will show up. Or there are many free ones available on websites, for example here: color picker website. For example, here's a nice plum color, with values r = 140, g = 40, b = 160:

Here's a way to make your background this color, or to set your pen color to this color:
dudraw.clear_rgb(140, 40, 160)        # draw a plum-colored background
dudraw.set_pen_color_rgb(140, 40,160) # set the color for future shapes
May I see some other shapes?
The code below shows some examples of lines and basic shapes that are affected by the pen radius.
#---------------------------------------------
# demonstration of some basic shapes in dudraw
#---------------------------------------------
import dudraw

# open a 600x200 pixel canvas, and set the scale to one unit per pixel
dudraw.set_canvas_size(600,200)
dudraw.set_x_scale(0,600)
dudraw.set_y_scale(0,200)
dudraw.clear(dudraw.LIGHT_GRAY)

# draw a vertical line, from (10,10) to (10,100)
dudraw.line(10, 10, 10, 190)

# change the color, and change the width of the pen to 4 units (which is 4 pixels in this example).
dudraw.set_pen_color(dudraw.VIOLET)
dudraw.set_pen_width(4)
dudraw.line(30, 10, 30, 190)

# make a green rectangle with a thick outline
dudraw.set_pen_color(dudraw.DARK_GREEN)
dudraw.set_pen_width(10)
dudraw.rectangle(100, 100, 50, 90) # center at (100,100), half-width=50, half-height = 90

# ellipse with thin red outline
dudraw.set_pen_color(dudraw.RED)
dudraw.set_pen_width(1)
dudraw.ellipse(200, 100, 30, 90) # center at (200, 100), half-width = 30, half-height = 90

# Blue quadrilateral
dudraw.set_pen_color(dudraw.DARK_BLUE)
dudraw.set_pen_width(3)

# The four vertices are (250, 10), (250, 190), (300,190), (275, 10)
dudraw.quadrilateral(250, 10, 250, 190, 300, 190, 275, 10)

# Sector, notice that the color and width were not changed, so the values remain as before
# The center is at (350, 100). The radius is 50. The last two parameters give the starting and
# ending angles, in degrees. Angles are measured as typical in mathematics,
# counter-clockwise starting at the positive x-axis
dudraw.sector(350, 100, 50, 30, 330)

# points: size is controlled by the pen width, parameters are just the location of the point
dudraw.set_pen_color(dudraw.CYAN)
dudraw.set_pen_width(10)
dudraw.point(450, 150)
dudraw.point(500, 150)

# elliptical arc: give the center point, the radius in the x-direction, the radius in
# the y-direction, and the start/stop angles.
# Angles are measured as typical in mathematics, counter-clockwise starting at the positive x-axis
dudraw.set_pen_color(dudraw.PINK)
dudraw.elliptical_arc(475, 150, 50, 100, 200, 340)
dudraw.show(10000) # display the result for 10 seconds
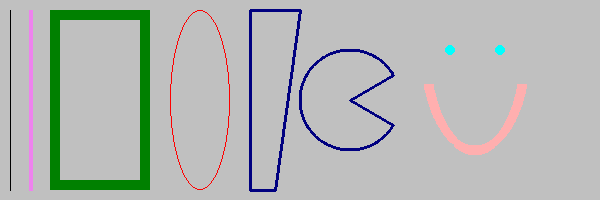
These are not the only shapes affected by the pen width setting. Others include dudraw.circle(), dudraw.square(), dudraw.polygon(), dudraw.triangle(), dudraw.arc(), dudraw.elliptical_sector(), and dudraw.annulus().
There are also dudraw primitives that produce filled regions rather than outlines, and these are not affected by the pen width. Here's a program with some examples of filled regions.
#----------------------------------------------------
# demonstration of some basic filled shapes in dudraw
#----------------------------------------------------
import dudraw

# open a 600x200 pixel canvas, and set the scale to one unit per pixel
dudraw.set_canvas_size(600,200)
dudraw.set_x_scale(0,600)
dudraw.set_y_scale(0,200)
dudraw.clear(dudraw.LIGHT_GRAY)

# draw a vertical line, from (10,10) to (10,100)
dudraw.line(10, 10, 10, 190)

# change the color, and change the width of the pen to 4 units (which is 4 pixels in this example).
dudraw.set_pen_color(dudraw.VIOLET)
dudraw.set_pen_width(4)
dudraw.line(30, 10, 30, 190)

# make a green filled rectangle with a thick outline
dudraw.set_pen_color(dudraw.DARK_GREEN)
dudraw.filled_rectangle(100, 100, 50, 90) # center at (100,100), half-width=50, half-height = 90

# red ellipse
dudraw.set_pen_color(dudraw.RED)
dudraw.filled_ellipse(200, 100, 30, 90) # center at (200, 100), half-width = 30, half-height = 90

# filled Blue quadrilateral
dudraw.set_pen_color(dudraw.DARK_BLUE)

# The four vertices are (250, 10), (250, 190), (300,190), (275, 10)
dudraw.filled_quadrilateral(250, 10, 250, 190, 300, 190, 275, 10)

# Sector, notice that the color was not changed, this sector is also dark blue.
# The center is at (350, 100). The radius is 50. The last two parameters give the starting and
# ending angles, in degrees. Angles are measured as typical in mathematics,
# counter-clockwise starting at the positive x-axis
dudraw.filled_sector(350, 100, 50, 30, 330)

# points: size is controlled by the pen width, parameters are just the location of the point
# The points are left in this drawing you so can compare to the images of unfilled regions
dudraw.set_pen_color(dudraw.CYAN)
dudraw.set_pen_width(10)
dudraw.point(450, 150)
dudraw.point(500, 150)

# filled elliptical sector: give the center point, the radius in the x-direction, the radius in
# the y-direction, and the start/stop angles.
# Angles are measured as typical in mathematics, counter-clockwise starting at the positive x-axis
dudraw.set_pen_color(dudraw.PINK)
dudraw.filled_elliptical_sector(475, 150, 50, 100, 200, 340)
dudraw.show(10000) # display the result for 10 seconds
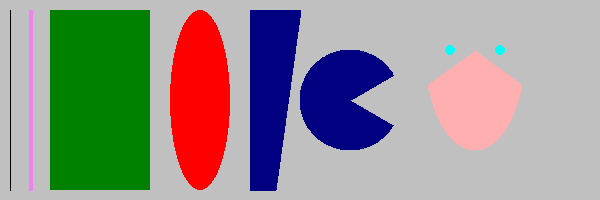
These are not the only filled shapes. Other examples include dudraw.filled_triangle(), dudraw.filled_circle(), dudraw.filled_polygon(), and dudraw.filled_annulus().
How do I change the scale?
By default, the scale in a dudraw canvas is [0, 1] x [0, 1], even if the size of the canvas itself is not square. For example, the code below produces the image shown. (The image is annotated to show the coordinates of a few points)
import dudraw

dudraw.set_canvas_size(600,400)
dudraw.clear(dudraw.LIGHT_GRAY)
dudraw.set_pen_color(dudraw.DARK_GREEN)
dudraw.filled_triangle(0, 0, 1, 0, 0.5, 0.7) # green triangle mountain
dudraw.set_pen_color(dudraw.YELLOW)
dudraw.filled_circle(0.8, 0.75, 0.1)         # yellow circle sun
dudraw.show(10000) # display the result for 10 seconds
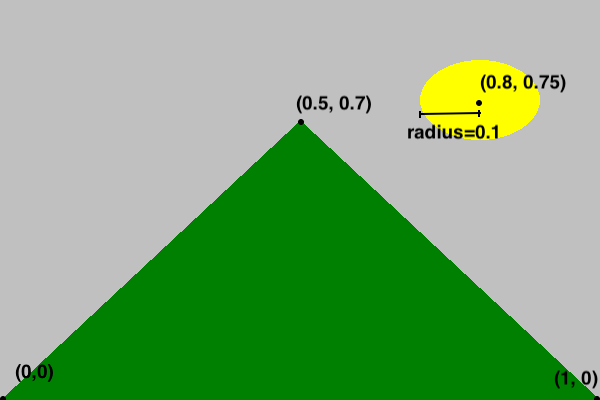
But sometimes you might prefer to set the scale to match the pixels, or some other scaling. This is often useful if the canvas is not square. Here's the code to produce a nearly identical drawing, with the scale on the x-axis and y-axis set to be different from each other, and to have one unit be the size of one pixel. The canvas was created with a width of 600 pixels and a height of 400 pixels. The x-scale is set to go from 0 to 600, while the y-scale is set to go from 0 to 400. Notice that each graphics primitive was modified to reflect the change of scale. The image below is annoted to show how the scale on the axes works.
import dudraw

dudraw.set_canvas_size(600, 400)
dudraw.set_x_scale(0, 600)
dudraw.set_y_scale(0, 400)
dudraw.clear(dudraw.LIGHT_GRAY)
dudraw.set_pen_color(dudraw.DARK_GREEN)
dudraw.filled_triangle(0, 0, 600, 0, 300, 280)  # green triangle mountain
dudraw.set_pen_color(dudraw.YELLOW)
dudraw.filled_circle(480, 300, 40)              # yellow circle sun
dudraw.show(10000) # display the result for 10 seconds
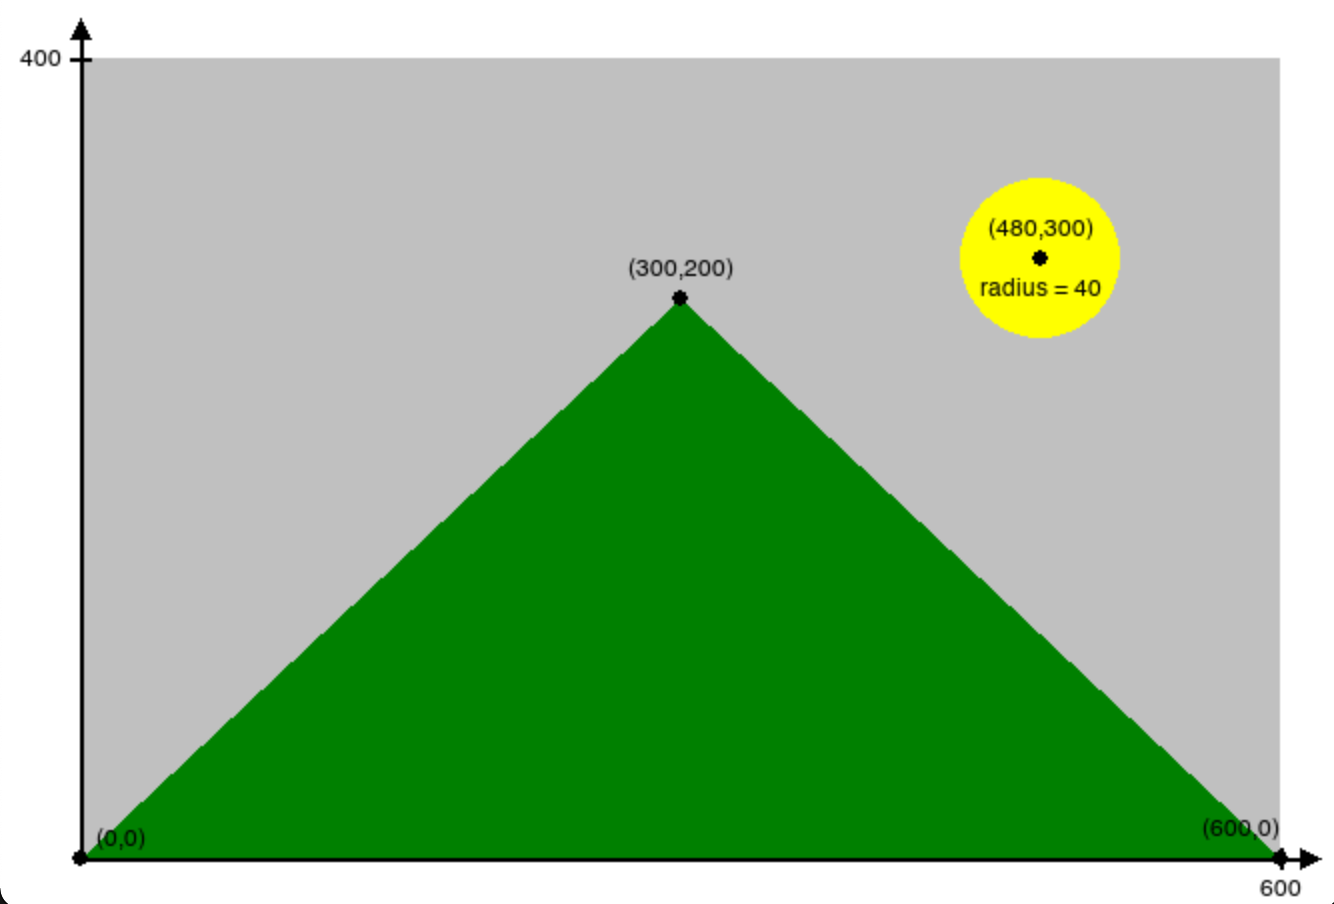
When you create a drawing, the first thing you should do is decide on your scale, since that is the basis for all of the numbers in each shape you draw.
How do I change the font and the size of text?
To change the font, use the method dudraw.set_font_family("FontName").
To change the size of the font, use dudraw.set_font_size(size).
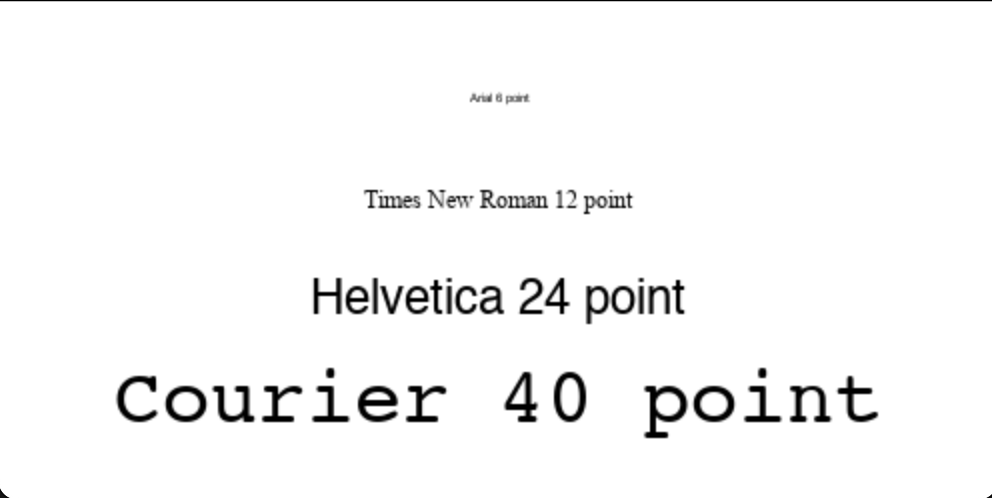
The size is in points. The default font family is Helvetica, and the default size is 12 points Here is demo code and the resulting image:
import dudraw

dudraw.set_canvas_size(500,250)
dudraw.set_font_family("Courier")
dudraw.set_font_size(40)
dudraw.text(0.5, .2, "Courier 40 point")
dudraw.set_font_family("Helvetica")
dudraw.set_font_size(24)
dudraw.text(0.5,0.4, "Helvetica 24 point")
dudraw.set_font_family("Times New Roman")
dudraw.set_font_size(12)
dudraw.text(0.5, 0.6, "Times New Roman 12 point")
dudraw.set_font_family("Arial")
dudraw.set_font_size(6)
dudraw.text(0.5, 0.8, "Arial 6 point")
dudraw.show(10000) # display the result for 10 seconds
How do I save my image in a file?
Use the dudraw.save() function to output .jpg files.
Here's an example of a program that draws a very simple picture, and saves the output to a .jpg file:
#-----------------------------------
# demo of saving to a file in dudraw
#-----------------------------------
import dudraw

# draw a red circle on a field of white
dudraw.set_canvas_size(300,300)
dudraw.set_pen_color(dudraw.RED)
dudraw.filled_circle(0.5, 0.5, 0.25)
dudraw.save("red_circle.jpg")
Notice that this program does not have a call to dudraw.show(). This means that, although the image is saved to the file, a window displaying the image is never opened, and the image is not displayed to the screen.
How do I get official details on all of the functions?
See here for the official documentation:
https://cs.du.edu/~intropython/dudraw/
And here for the source code: